Lab 6
Introduction:
The purpose of this lab is to conduct a survey with a grid based coordinate system. The techniques learned in this lab are to be used when 'technology' is not readily available or usable. It is important to be able to follow through with a survey no matter the measurement tools at hand. For this lab, we are to preform a survey in Putnam Park. The survey is to be conducted by using distance and azimuth. This method is a very basic survey technique, and is similar to the point-quarter method and mapping out linear features on the landscape. The distance and azimuth method uses a handheld compass and a handheld rangefinder. While out in the field, we also learned about the following survey equipment: a GPS, tape reel, and a sonic distance finder.
Study Area:
The study area for this lab is Putnam Park Drive. We were on the gravel path with our backs to the ridge looking out into the swampy marsh area. We recorded the coordinates for one place and took each measurement from that exact spot. The coordinates for each point of origin (there were three points for the entire class) were recorded and shared throughout the class. Each point of origin had the distance and azimuth for ten different trees in Putnam Park.
Methods:
After choosing the point where we were going to take our points from, we needed to retrieve the coordinates of the point of origin. The Bad Elf GPS gave us the coordinate point and we recorded it in our field notebooks. All of the groups used this GPS to attain their point of origin. We then proceeded to record the distances of the trees to the point of origin with the laser targeting range finder II. We then recorded the azimuth with the Suunto compass. The compass was previously adjusted 1 degree for declination. Figure 1 below shows two of my colleagues using both of the measuring tools we used to gather our information.
 |
| Figure 1: Colleague 1 on the left using the Laser to find the distance, and colleague 2 on the right using the compass to find the azimuth |
 |
| Figure 2: Colleague 3 using the tape reel to measure the diameter of the tree trunk |
 |
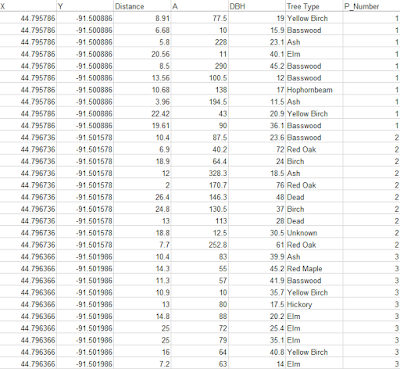
| Figure 3: The normalized data from the tree survey |
 |
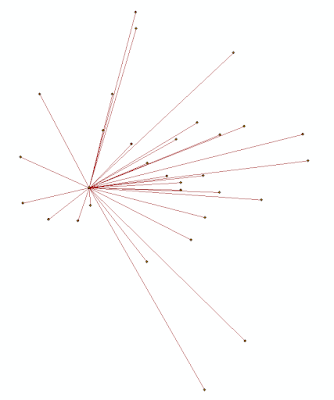
| Figure 4: The 'Bearing Distance' tool created the lines from the point of origin |
 |
| Figure 5: The 'Features Vertices to Points' tool creates points at the end of each distance line |
Results/Discussion:
After creating a digital image in a GIS, the distances and azimuths for each tree seemed to differ greatly. I would not suggest this method of retrieving data to anyone who wants an accurate data set. The readings of the distance finder and azimuth had some large differences, and this is because of human error. All six group members took each type of measurement and that in and of itself results in error. There is also the fact that we are different heights and we were not standing on the exact point of origin 100% of the time. After we recorded out point of origins coordinates, we went to use the sonic distance finder to survey the trees. The sonic distance finder did not work for my group, so we had to revert to using the laser targeting range finder II. Technological difficulties occur even when the survey equipment seems unbreakable. This particular solution was solved by using a different distance measuring tool, the laser targeting range finder II. All of these tools are accurate enough to retrieve points and data that is close to the actual numeric value.
Conclusions:
If you know the exact point of origin down to the coordinates, it is possible to use the distance azimuth surveying method to attain data even though a GPS is not at hand. The better the equipment, the more accurate the data results will be. If this survey was to be recreated, I would go with the point quarter survey. The point quarter survey takes random survey points in a measured out grid with four large quadrants. I believe it is crucial to know how to use the distance azimuth survey method for future endeavors when the use of technology is not permitted or accessible.
No comments:
Post a Comment