Introduction:
This lab is intended to teach how to engage in a survey of various point features on campus using a high precision GPS unit. The data will be collected as a collectively . Each person will take turn with a partner to take a GPS point with the GPS unit. The data gathered should then be turned into continuous interpolated maps. The following interpolation methods should be used: IDW, Kriging, Natural Neighbor, Spline, and TIN.
Study Area:
The study area for this lab is a green patch of grass near the 'Sprites' between the buildings Centennial and Schofield. Figure 1 below is a map of the study area. The data points are seen below between the two academic building. This is a common area where students gather and 'chill' before or after classes.
 |
| Figure 1: A map of the study area where the data points were collected |
Methods:
The data points were gathered with a survey grade GPS that has sub centimeter accuracy. The GPS records the points though a bluetooth connection. The points were gathered using a random sampling method. The random sampling method is a great method to use because it is an unbiased way to acquire a random sampling of data points. Figure 2 below are the data points that were gathered in the lab.
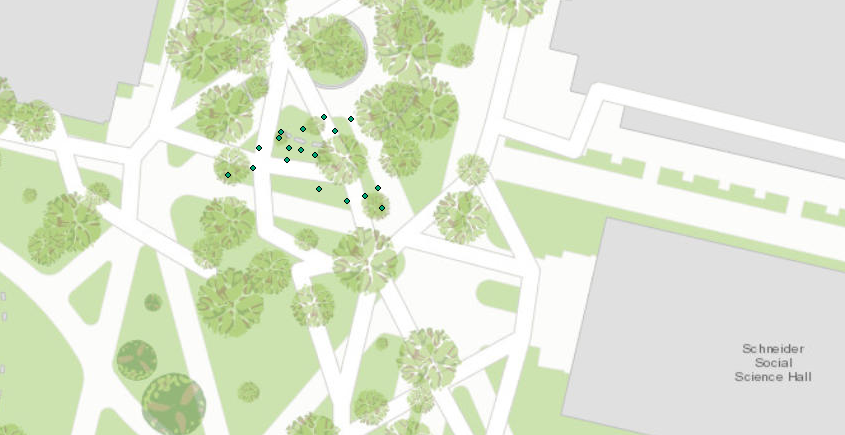 |
| Figure 2: The data points gathered with the survey grade GPS |
The following methods are: the following: IDW, Kriging, Natural Neighbor, Spline, and TIN.The inverse distance weighted (IDW) interpolation method is used to predict the elevation of the continuous surface surrounding the data points. The Kriging method generates an estimated elevation of the surfaces surrounding the data points by using the elevation of the data gathered as a reference. The Natural Neighbor method is similar to the methods above except the elevation data used as a reference is taken from data points that are near the area in question. The spline method uses a polynomial algorithm to create the continuous surface model with the elevation points gathered with the class. The last interpolation method used was TIN. A triangulated irregular network (TIN) is a representation of elevations created with triangles calculated with the gathered three-dimensional coordinates.
Results/Discussion:
The first interpolation is seen in figure 3 below. The inverse distance weighted interpolation (IDW) method shows the elevation for a small grass area with a knoll on it. The areas in the left upper portion of the map are areas of high elevation because the points were taken on the knoll above the rest of the grassy area.
 |
| Figure 3: The IDW interpolation was used on the data points in the map above |
 |
| Figure 4: The kriging interpolation method was used on the data points in the map above |
 |
| Figure 5: The natural neighbor interpolation method was used on the data points in the map above |
 |
| Figure 6: The spline interpolation method was used on the data points in the map above |
 |
| Figure 7: The spline interpolation method was used on the data points in the map above |
Conclusion:
Upon the conclusion of this lab, it was clear that the stratified sampling method is a better data gathering method than then random sampling method. The stratified sampling method was used in a previous lab for this class. If this lab were to be conducted again in the future, a word of advice would be to spread out the data points in the area of interest. Another word of advice would be to make the interpolated maps somewhat translucent to see the area in which the data point was taken. Overall, this lab was interesting and informative which made the interpolation process enjoyable.
No comments:
Post a Comment